In the previous section we did a factorial ANOVA; this would be OK if Subject was the experimental
unit, i.e. each subject provided only one piece of data.
–
BUT in the studies we do, e.g. in a rating or production measure study,
it’s more common to have each subject provide data for multiple conditions
– i.e. to give multiple ratings or produce multiple items – maybe not for
every condition, but at least for more than one. This
is almost always the case for speech production and acoustic phonetic studies.
It is rare to make only one measurement for a single subject, unless it is
some global measure, or a very small study.
Max
& Onghena (1999) (Some issues in the statistical analysis
of completely randomized and repeated measures designs for speech, language,
and hearing research, JSLHR 42: 261-270) offered a critique of our field’s
practice (common at that time) of using factorial ANOVAs to analyze such studies: that they use repeated measures
designs and should be analyzed instead with repeated measures ANOVAs.
Repeated
measures = multiple measures per
subject -- factors are varied “within” rather
than “between” subjects
(from
the StatView manual, p. 82-3: "the measurements taken on each experimental
unit are essentially the same but measured under different times or experimental
conditions" – called "within-subject" variables)
Compare:
non-repeated measures ("between-subjects"):
each condition in the experiment is provided by a different group of subjects
(e.g. imagine that VOT data from an alveolar-before-/i/ condition is provided
by one group of speakers, while VOT data from an alveolar-before-/a/ condition
is provided by another group!)
some repeated measures: e.g. a French dataset
is provided by French speakers, and an English dataset is provided by English
speakers, but each French and English speaker provides a set of VOT measures
for all the various conditions
all repeated measures ("within-subjects"): each
subject provides all the conditions of the experiment (including use of bilingual
speakers to compare two languages)
A repeated
measures design increases the sensitivity of the test as subjects serve as
their own controls, and thus across-subject variation is not a problem. In this sense it’s easier to get a significant difference
with RM ANOVA. However, because subject is the experimental
unit and the observations within a subject are not independent, the df in
the RM analysis are lower than in a design with lots of subjects, thus making
it harder to get a signficant difference.
The key point is
that the experimental unit is the subject, not the token or repetition. This point leads to another criticism of our practice by
Max & Onghena: that single-subject analyses,
with token as the experimental unit, are not valid. Because
the observations are not independent, the df used is too high and the significance
is overestimated. It’s true that we see analyses of
individual subject data all the time in journals, but they say this is simply
an error, no matter how often it is done.
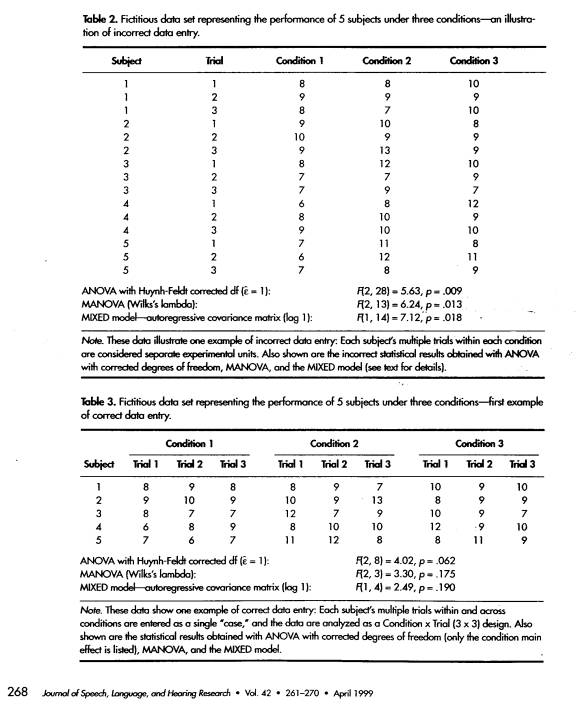
Datafiles from
a repeated measures study are generally set up with each subject on a single,
separate, row, and each column containing data from one condition of the experiment - the compact format presented above. Because
repeated measures designs allow you to use fewer subjects, the typical datafile
has relatively few rows (subjects) and relatively many columns (conditions). Compare the "right" and "wrong" data entry tables given
by Max and Onghena, reproduced here: each row is a subject in the correct
format.
Look at
the file compactdata.xls,
sheets 1-4, for data from various designs with within-subject factors,
and rows always subjects. (The structure of the columns is made clearer
in this file by adding rows at the top with full labels for each level
of the factors. However, to open these sheets in SPSS and have the
working column labels recognized, those extra top rows have to be
deleted.)
One reason students sometimes avoid Repeated Measures analyses is that there is no automatic option for post-hoc tests. See Hays section 13.25 (p. 579-583) about using Scheffe and Tukey HSD procedures or Bonferroni t-tests for post-hoc testing of within-subject factors; see Winer p. 529 about using a factorial 1-way ANOVA for testing simple effects (a comparison of levels of one factor to a single level of another factor).
In the next section we will do a Repeated Measures ANOVA in SPSS.
last updated
July 2011 by P. Keating