- Praat (page of resources compiled by Kevin Ryan for the lab)
- VoiceSauce, our EE colleagues' free program for voice analysis
- Utilities to convert/split .pmf files into .wav files, to invert .wav files, to format .wav files so they can be read in Emu databases: these are part of EggWorks (EGG analysis program), which as of April 1 2022 will be unavailable for public use; we hope this situation will be temporary.
- PCquirer family
- formant plot programs
- Bureau of Glottal Affairs Voice Analysis Software, which members of the lab have used for inverse filtering, LF modeling, and voice synthesis
|
|
|
|
|
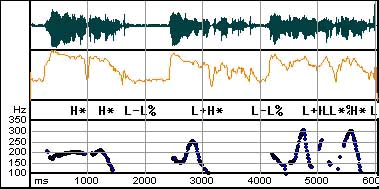
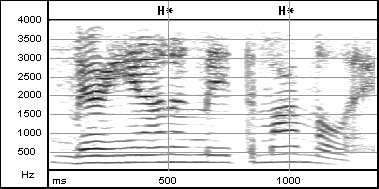
Pitch track with ToBI
labeling
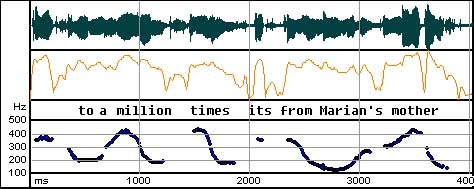
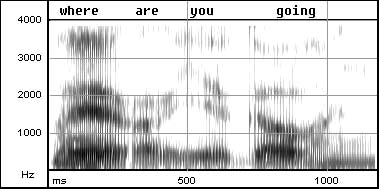
Pitch track with text
labeling
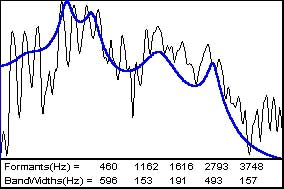
FFT/LPC with formant
/ bandwidth values
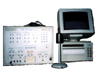
The Kay 5500 Sonagraph is located in the General (largest) computer room of the phonetics lab, where it serves as a museum piece. However, it still functions, though the monitor makes an alarming noise.
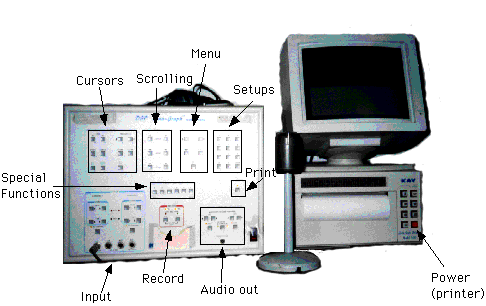
2. Basic Layout
The sonagraph consists of three components: a printer, a monitor and the console (depicted above). Additionally, a microphone is usually in the vicinity for inputing data into the sonagraph. The on/off switch is located on the power strip behind the console. There is also a small black power switch in the bottom right corner of the console; this switch has tape over it and should not be tampered with.
3. Console
The console consists of several buttons which are grouped according to the functions they perform. There are nine groups of buttons, each delineated by boxes (see picture above). Six boxes are outlined in gray, one in blue, and one in red. These will be discussed in turn.
Input: The input region of the console is outlined in blue and is located in the bottom left corner of the console. Data may be inputed from either a microphone or from another source (e.g. tape recorder, DAT recorder, computer, etc.) into one of two channels. The choice of channels does not make much difference, though the default is typically channel 1. There are four input plugs, two for microphone and two for auxiliary cables, one of each per channel. Input levels can be adjusted in increments of 1 or 10 decibels by pushing the buttons in the smaller blue boxes within the larger blue box. The decibel levels pop up on the monitor when the input level buttons are pressed.
Recording levels register on the red lights in the input box. Ideally, recording levels should fall within the range indicated by an illuminated green light. If the red light is illuminated, recording levels are too high and should be lowered.
Record: The record box is red and is located in the middle of the bottom third of the console. Pressing the on button begins the recording, while pressing the off button stops it. The recording continues until the off button is pressed, at which point the monitor will display the message: Enhance is necessary. This message is your cue to press the E button in the special functions menu (see below).
Special functions: The special functions region is
in the middle of the console and delineated in gray. It consists of
six lettered buttons. The most important of these buttons is E which you
must press after you press the off button to stop recording. Pressing E
allows the sonagraph to enhance the image(s) corresponding to what was
recorded. Pressing D gives a few options for redrawing and aligning the
screens. Pressing F changes the color(s) of the images; keep on pressing
F to see the various options which range from traditional white and gray
to various shades of fire. Pressing C provides you with various options
for playing the data which is stored on the screen. Some of these options
require cursors. Buttons A and B are rarely used.
A allows one to vary the reference amplitude for the displays and B is non-functioning.